
Appearance
Debugging Workflows
Situate contains an integrated debugger to debug a workflow's code. Debugging information is visible through the Workflow Log View.
The first step is to turn the debug settings on.
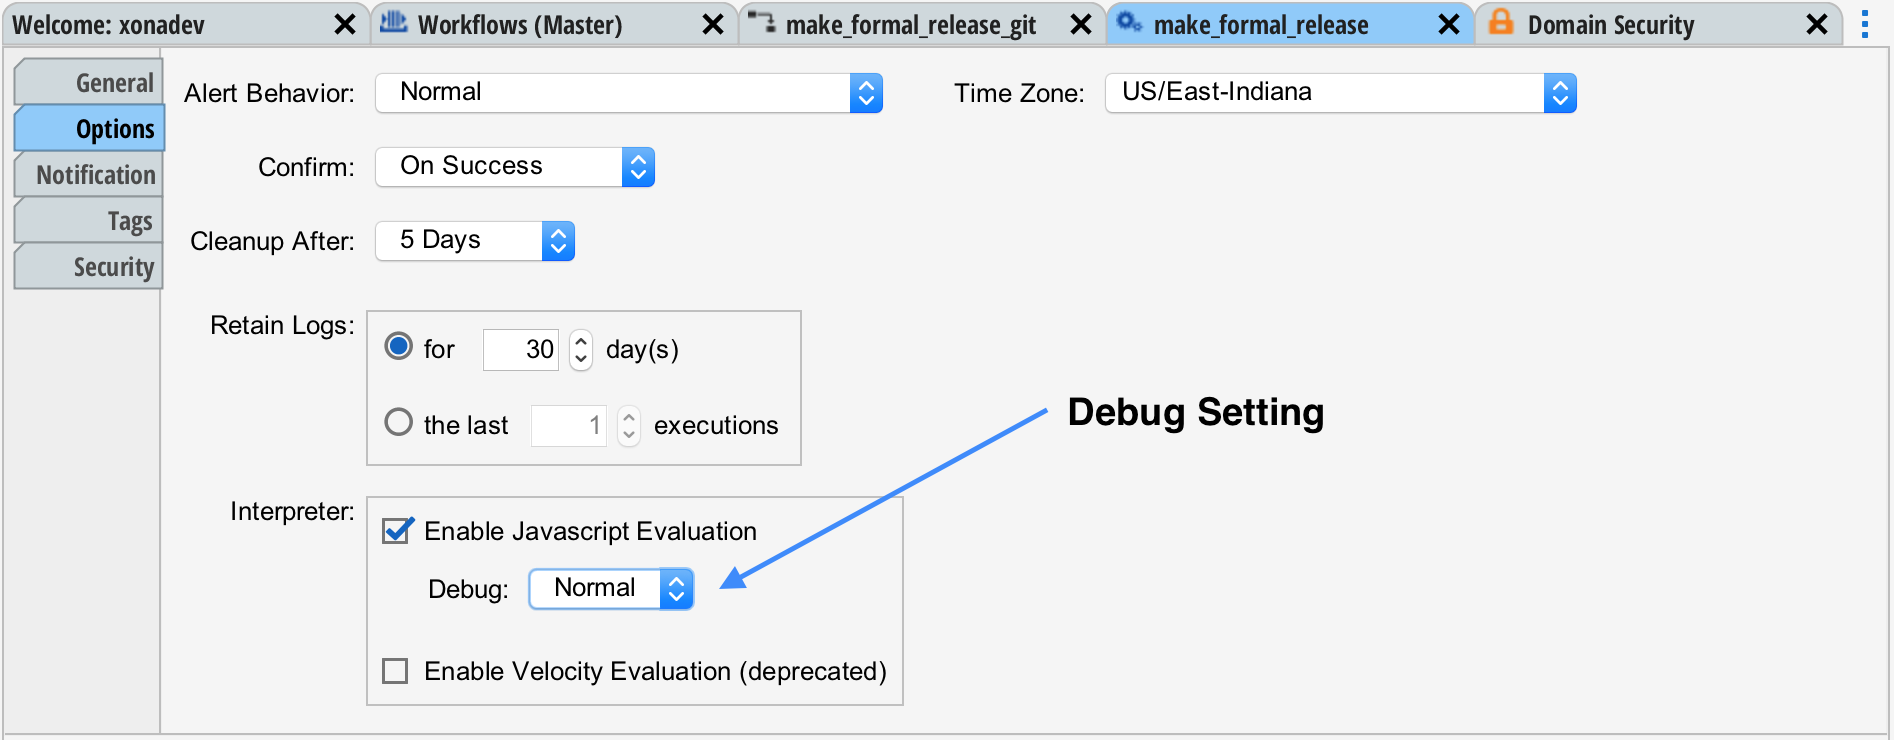
This done by setting Debug: to "Normal" in the Workflow Designer's Options tab.
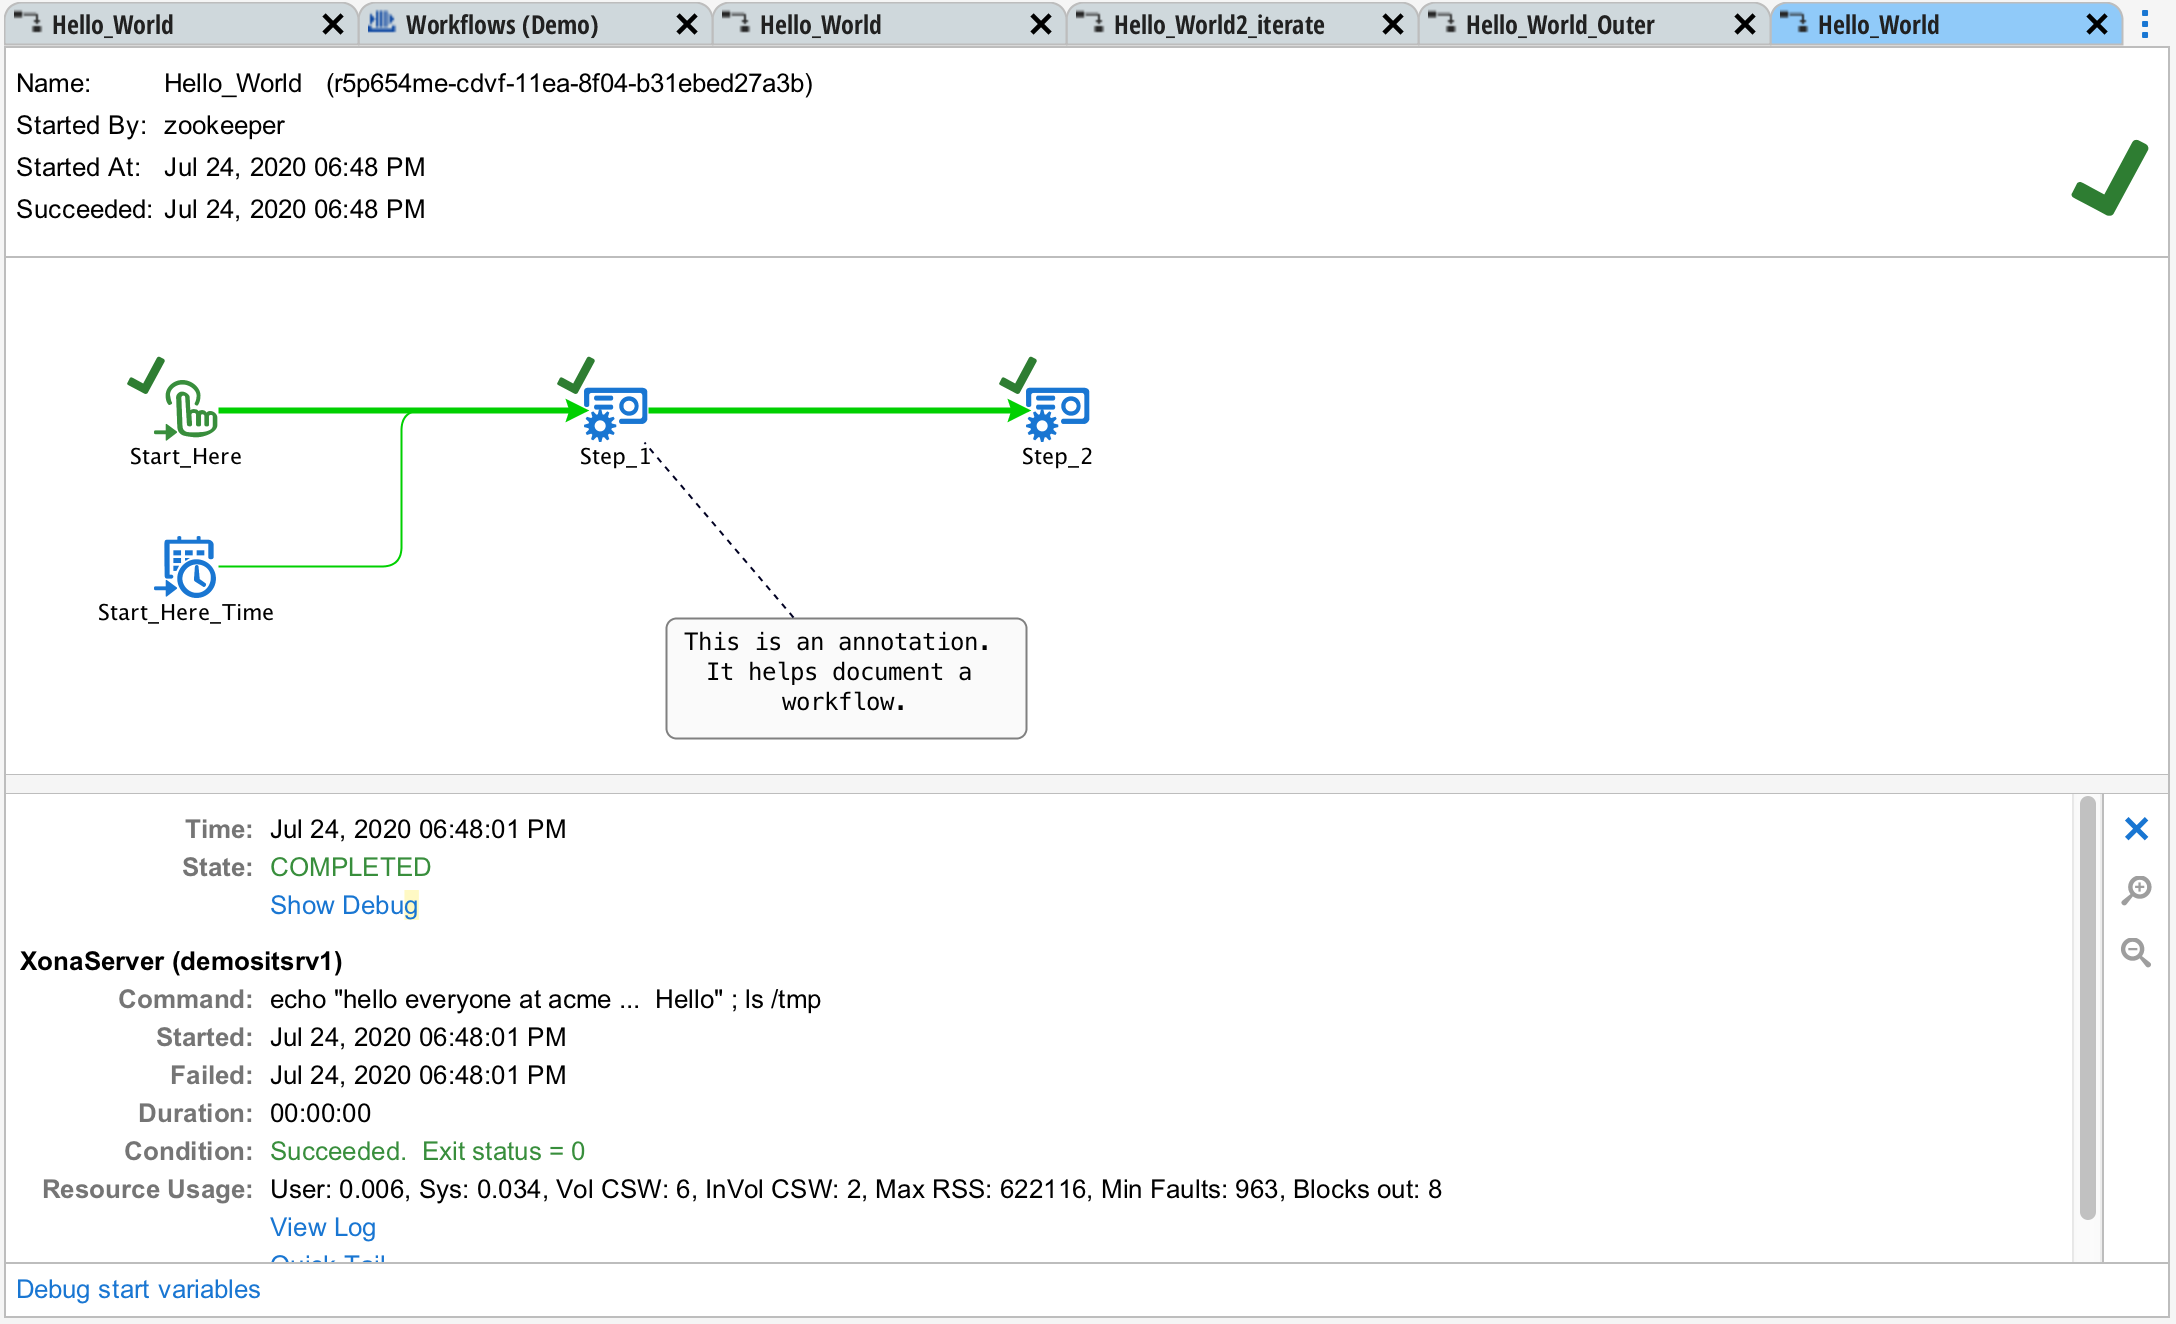
Now when the workflow runs, debugging information is collected. For tasks and triggers, "Show Debug" button will now be part of the state detail. Press this button to open a debugger window in the Output Section of the UI.
Debug Start Variables
At the lower left, there is also a button "Debug Start Variables". This button opens the debugger for code run in the groups or queues prior to the workflow starting.
The Debug Window
The debug window will open at the bottom as a tab in the Output Area

The information presented is a list of records each pertaining to a time when code was executed or a string was expanded.
Source
The source describes where the code was executed. The format is <object type>/<object name>/<field>. in the example above the first record is "task/Step_1/command". This means the command field of the task, Step_1.
Input
The input to the Javascript engine is shown on this line.
Status
The status of the Javascript engine for this record is shown. It will be succeeded or failed.
Result
The result of the execution of the code or expansion.
Result Type
The Javascript type of the result.
Error
The specific error that occurred if an error occurred. The format of the error is that of Javascript.